Investment Planning
Why to invest?
I was once talking with my grandmother and she told me the price difference between when she was young and now. She told me that she was getting married in the year 1964 to a man (my grandfather) whose salary was a mere ₹500/month and with that they used to buy groceries worth ₹30/month. Now, I have to buy the groceries worth ₹7000-₹8000/month. This made me realise that if we do not invest and depend only on the current salary, we might not have enough to survive in the future. Similar data could be found on the internet to match the story and I have plotted the following "Price Difference" graph.
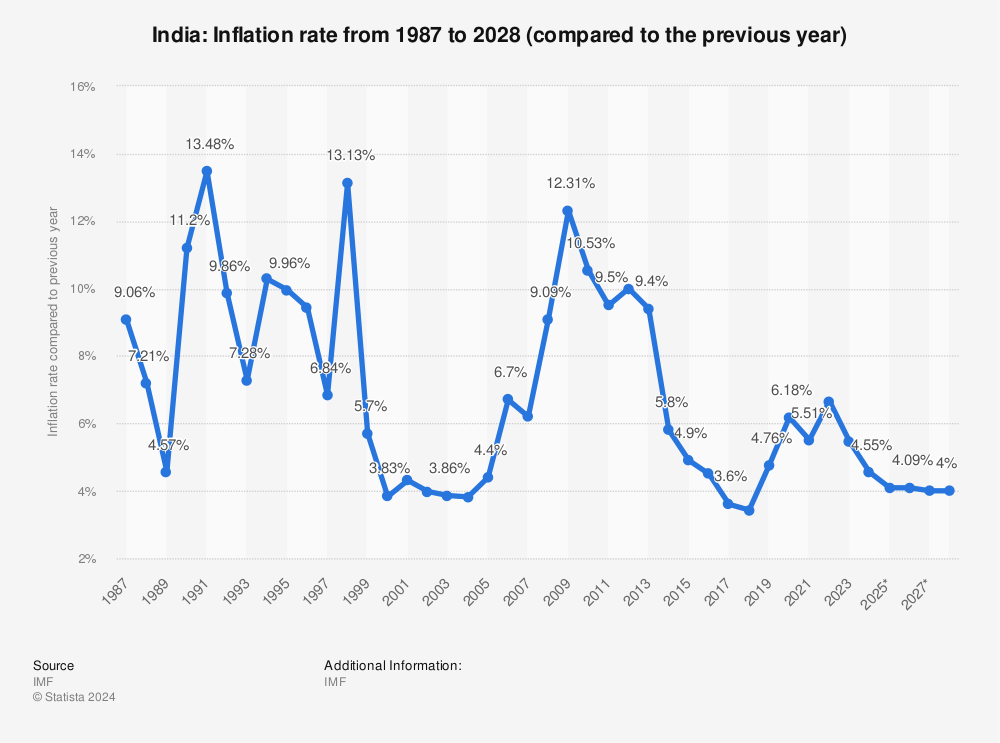
The graph on the top-right side is of inflation rate over the years and we can take an average of 6% inflation per year. So, if you are not increasing your money intake at the same rate, then you will not be able to afford basic necessities after a period of time. Let us take an example to understand the gravity of this situation.
A few assumptions before we start:
- Monthly salary
of
₹50,000/- with increment of 8% each year on average.
- Monthly expense
of
₹30,000/- increasing at a rate of 6%.
- Inflation rate 6% on average.
- Current age is 30.
- Retire at 50.
- You are an individual without any dependents.
Computing the money you will have at retirement is shown in the table on the right.
So, at the age of 50, you will have a sum of ₹
to spend for the rest of your life and now without any income and based on the continued expenses, it will take hardly 8-10 years for you to finish the corpus. So, to live through the life after retirement, we all should invest in some form of retirement planning.
In the next segment we will go through how to analyse your current scenario and plan for future.
How to invest?
To know how to invest, firstly, we need to analyse the current situation. Put your information in the below places to visualise your needs, wants, and savings. Don't worry, the information will not be saved.
₹
Wealth accumulated based on the values mentioned above.
Years
Years for the wealth calculated on the left side to become 0.
If you analyse your expenditure and remove unnecessary things, it will automatically increase your savings. You can try it in the above form by reducing the wants and needs by 1% each and see what happens to the wealth. You will notice a drastic increase in wealth and years for that wealth to become zero. This implies that with a little bit of savings, you can increase a lot of wealth. I will update this space with ways to reduce needs and wants so, keep looking out for that. On top of that, if you invest the savings in any of the investment instruments, which we will discuss later, you can grow the money even more. Let's try to visualise the same amount with an additional 8% and 10% Return On Investment (ROI) each year.
As can be seen in the graph, the amount at the end of 20 years significantly increases and possibly adds 4-5 years further for the wealth to reach zero.
So, you would need to analyse two things in order to gain those extra years.
- One is to scrutinize the needs and wants and reclassify the expenditure in order to increase the savings.
- Second task is to screen the investment instruments to invest in which will give you proper return.
What to invest in?
There are numerous instruments available in the market to put your money into and with that comes the huge task of planning of the instruments which are suitable for you. Here is a list of instruments:
-
Primary; easy; safe; low return.
- Savings Account
- Fixed Deposit (FD)
- Recurring Deposit (RD)
-
Tax Saving; long term; locked-in.
- Public Provident Fund (PPF)
- National Pension System (NPS)
- Equity Linked Savings Scheme (ELSS)
- Tax Savings Fixed Deposit
- Unit Linked Insurance Plans (ULIPs)
-
Commodities; all-time;
- Gold
- Silver
- Metals (other than gold and silver)
- Energy (Crude oil, Natural gas)
- Food (Cereals, pulses, fibres, oil/oil seeds, etc.)
-
Real Estate; all-time;
- Residential (Apartments, Condominiums, cooperatives)
- Commercial (Malls, shops, hospitals, offices, hotels)
- Real Estate Investment Trusts (REITs)
- Land (Farm, Cattle, forest)
- Industrial (warehouses, godowns)
-
Debt; Medium Risk; Medium Reward; Money market;
- Mutual Funds (Debt)
- Corporate bonds
- Government Securities
- Treasury Bills
- CP/ CD (Commercial papers/ Certificate of Deposits)
-
Equity; Share market; volatile; high-risk; high-reward
- Market Capitalisation (Large, Medium, Small, multi, hybrid)
- Sector (Food, Automotive, Drinks, Energy, Finance, Healthcare, Construction, etc.)
- Theme (Electric Vehicles, Agriculture, Urban, Rural, etc.)
- Mutual Funds (Equity)
Now, you can see there are so many instruments listed and there are many which are not even listed here, one obvious question arises in the mind is that which of these are the perfect products of investment. Let me get this very clear: There is no one or perfect investment product. Every individual has their own goals, risk appetite, dependencies, etc. So, YOU have to identify which product to choose for which, you need to find out what your goals are, what is your risk appetite, etc. Once your goals are clear, you can choose the products and start investing.
Risk Management
Risk is a real entity which all of us should always be aware of and try to mitigate that
risk to live a good life. There are a lot of risks involved in our day to day
activities.
___________________________________________________________________________________
Under Construction
___________________________________________________________________________________
Diversify
Risk apetite
Equity(stocks), Debt(FD, PF, Bonds, GS), Real Estate(House, Comercial, REITs),
ETFs(indices), commodities, international(all of the previous classes in foreign
market).
With averaging, you'll buy more shares when prices are low, and fewer when prices are
high.
Exit strategy
have stocks with mixed-income, growth, market capitalization among other metrics
___________________________________________________________________________________
This chart is just an example of risk vs portfolio diversification to understand how it works and could be a safe way to park your hard earned money
Risk-o-Meter
Disclaimer: I am not a professional legal or financial advisor and the contents written in this website are based on my learning and research and are just for educational purposes. Please read all the necessary documents before investing in any form or instrument.